Case Study: Azure Log Analytics event logging integration with Splunk
Requirement
In a multi-cloud environment there may be a requirement to consolidate and collate events into a single Splunk repository. The solution may require high availability, least amount of administrative effort, avoiding public endpoints, security, scalability and secure connectivity. There are multiple ways of integrating Splunk with Log analytics or to process Azure events and send them to Splunk. This case study covers one way out of many.
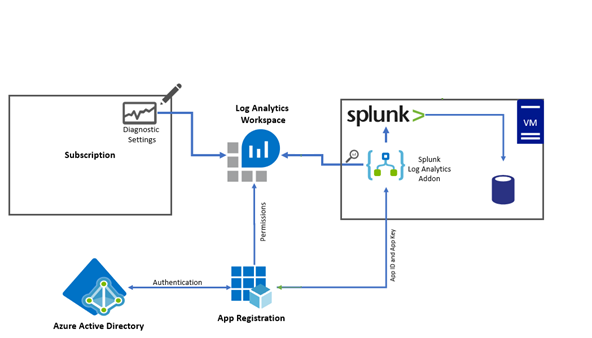
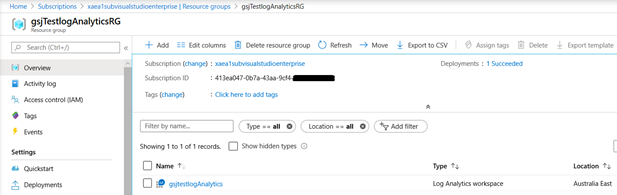
Step 1: Setup a Log Analytics workspace
We need to create a log analytics workspace that would be used to point diagnostic settings from Azure resources, subscriptions, AAD. You can easily manage retention log policies and alerts for log analytics workspaces. The log analytics workspace is a very versatile, highly available, scalable and reliable solution which requires very little administrative effort once setup.
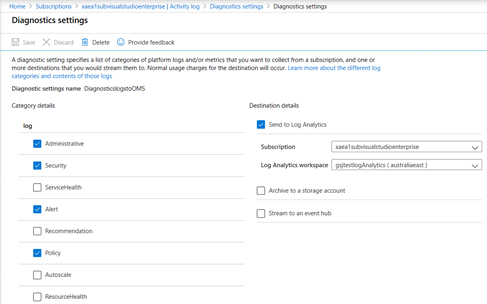
Step 2: Set diagnostic settings on Subscription
Below screenshot shows diagnostic settings for subscriptions can be setup to send events to the log analytics workspace. The process is identical for Azure resources and AAD. We can use Azure policies to enforce diagnostic settings to be integrated with log analytics workspace automatically. A remediation policy can add the diagnostic setting to applicable resources. We can enforce and deploy OMS Extensions to Azure VM’s to ensure System and application logs are sent to log analytics workspace from Windows VM’s and Syslogs incase of Linux. There are built-in Azure policies available in Azure that can install the extension as soon as a new VM is deployed or remediate existing VM’s by installing the extension automatically.

Step 3: App Registration in the Active Directory
The Splunk Add-on in Splunk would need the APP registration ID and key to connect to log analytics and pick the logs directly from the Log Analytics workspace. The same App registration details can be used by the Python/Powershell scripts running in an Azure function if needed to make rest API calls to fetch the logs.
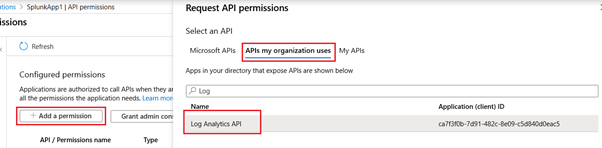
App Permissions
The Azure Active directory allows registering apps that can have specific permissions. We will need to create an app registration with the least allocated permissions just enough for it to access the logs from the log analytics workspace. Go to Azure Active directory and create a new App registration. For this example I named the APP “SplunkApp1”
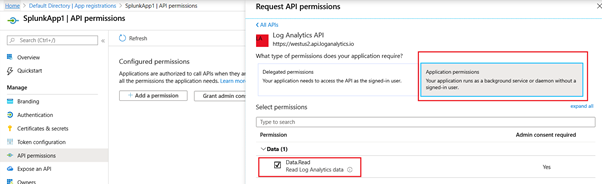
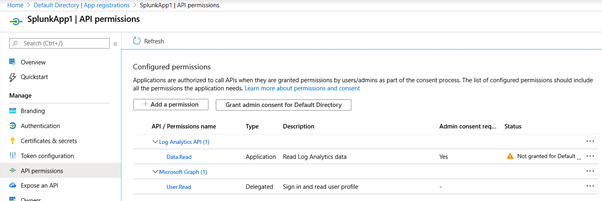
The App registration is done with the following permissions. This can be done by clicking “Add a permission”, click “API my organization uses” and then search and select the “Log Analytics API”, expand “API permissions” and check the box for “Data.Read”.
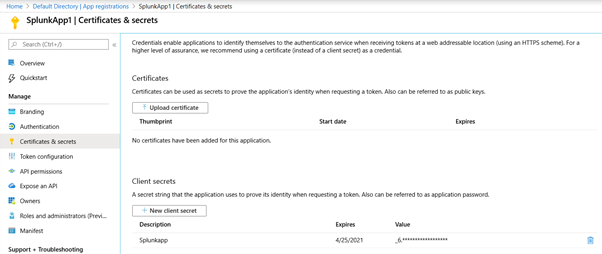
App Secret
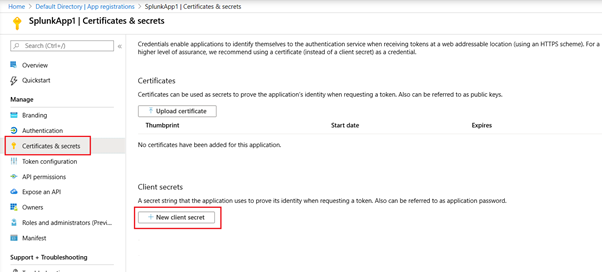
The App secret needs to be created to allow it to be used as a password for the app registration. To create an app secret, click “Certificates & Secrets”, then “New client secret”.
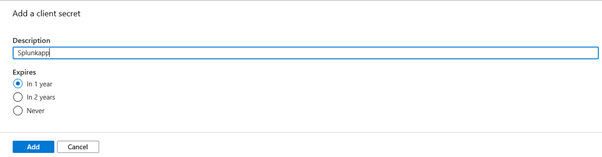
Give a description and choose the expiry. I used the expiry as 1 year for this exercise.
Once the secret is created, note it and keep it safe as the secret cannot be retrieved later. You can however delete the secret and recreate it again later but you will need to change the references in code or anywhere this secret is used. It is a good idea to keep it somewhere safe. A Keyvault may be a good idea.
See the screenshot below
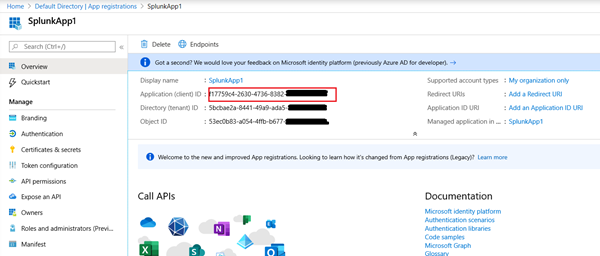
Now also note the App ID from the overview page
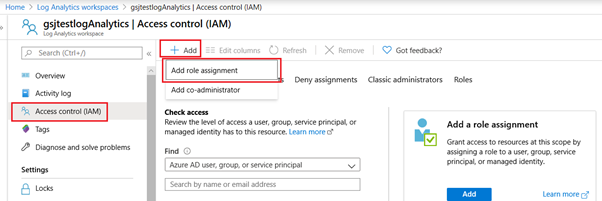
Step 4: Permissions for APP to access the log analytics workspace
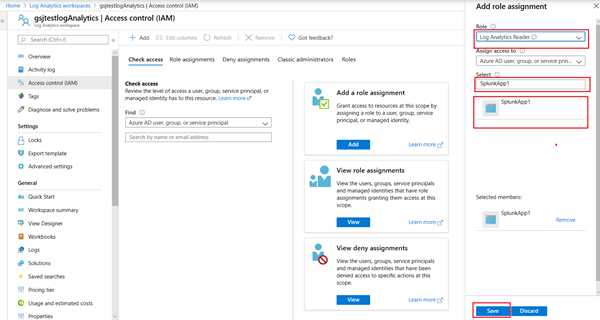
We need to allow the app id with its secret to be able to talk to log analytics. Once again for this purpose we will allocate the minimum required permissions for the APP on log analytics workspace. For this we will need to revisit the log analytics workspace and setup the IAM roles. Click the “Access Control (IAM)” on the log analytics workspace and then click “Add” and then “Add role assignment”
Add the “Reader” role and search for the “SplunkApp1” as shown below and click save.
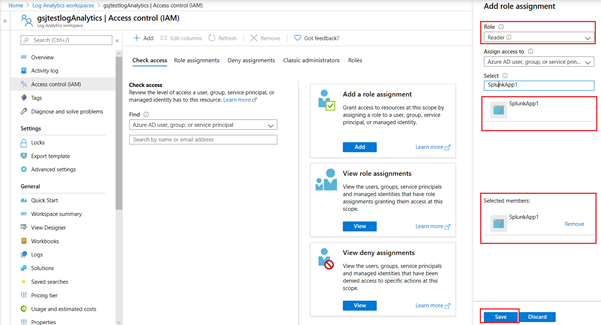
Repeat the steps above to add the role “Log Analytics Reader” as shown below.
Step 5: Setup Splunk
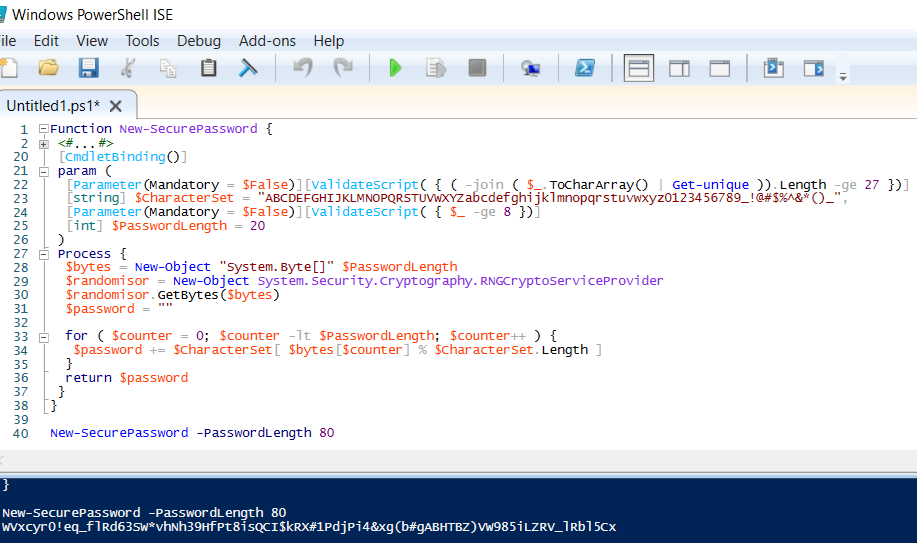
For this Excercise I used an existing Azure VM with Windows 2016. Since Get-random is not considered secure, static code analysis tools flag it as a concern so I used an RNG crypto based password. I used an 80 character password. You can see my code for the same at https://github.com/jutlag/CommonFunctions/blob/master/New-SecurePassword.ps1
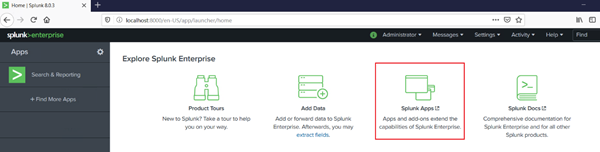
You can alternatively use a containerized version of Splunk as a test. For the purpose of this excercise I downloaded and installed a free version of Splunk Enterprise and installed Splunk on the VM. After the Splunk enterprise application is installed, open the browser and login to the splunk console. Download the Splunk app (add-on) from https://splunkbase.splunk.com/app/4127/ and then from the splunk console, click “Splunk App”. Then from the apps menu on the top select “Manage apps”
Click “Install app from file”
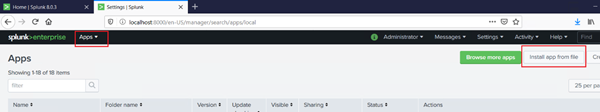
Browse the system to the downloaded tgz file and then click “upload”.
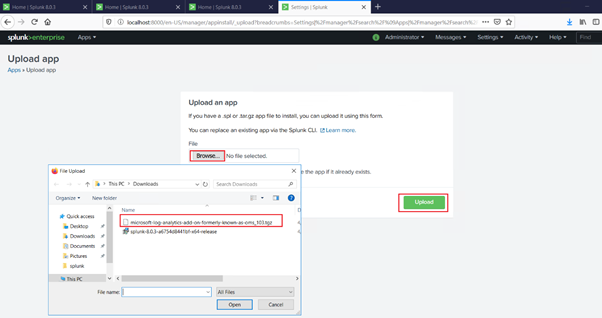
This should install the “Microsoft Log Analytics app” for splunk as shown in the screen shot below.
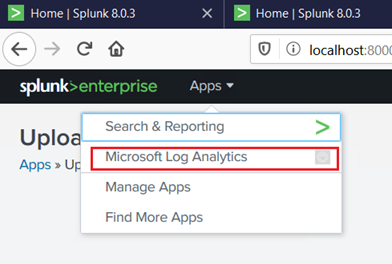
We would need to configure it, Click the app and Then Click the “Create inputs” button
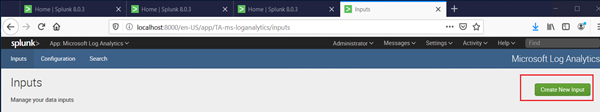
Input the details for the Log analytics workspace where you want the Splunk add on to connect to and fetch the logs.
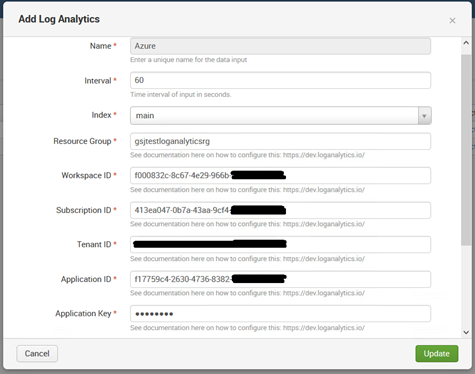
Scroll the input and provide the details for the Kusto query you want to run. You can run the Kusto query in log analytics workspace and ensure you can get the desired results, before adding it in the splunk addon.
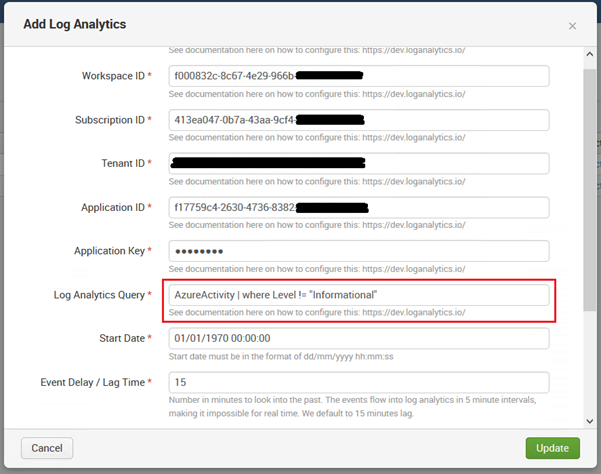
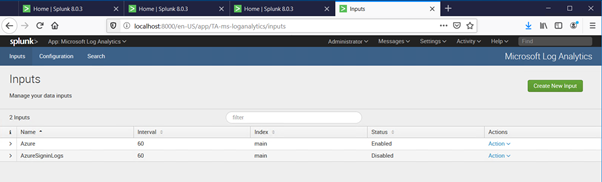
In the above example I have used Azure activity and no specific filters since my test environment is relatively small so there aren’t too many logs of interest. But we can create multiple queries with specific Kusto queries. I created an additional query for sign in logs as shown below.
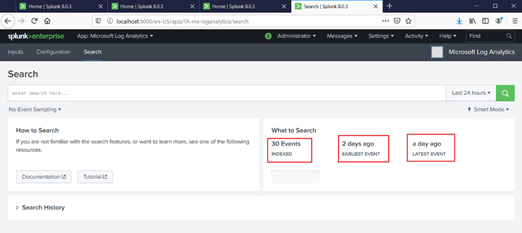
In a few minutes you should start seeing logs from Log analytics appearing in Splunk
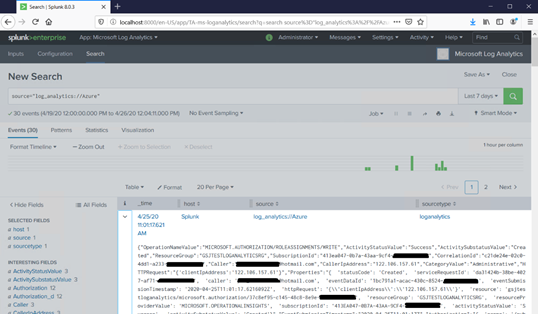
Step 6: Viewing Logs Analytics logs in Splunk
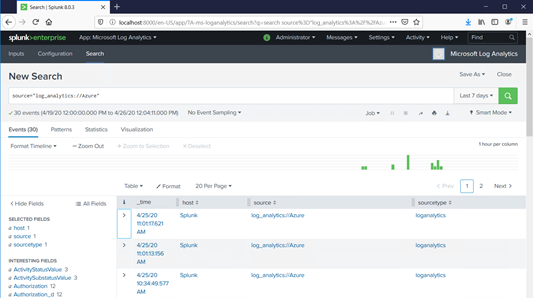
After following the above steps my Splunk console started showing the logs from Log analytics
Step 7: Using Code in Azure Function
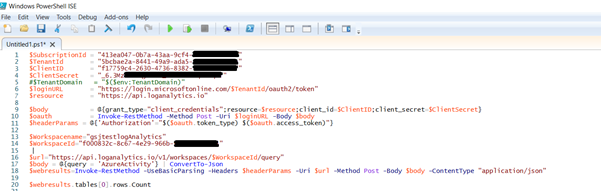
We may have a use case where Azure function needs to fetch the events from the event logs and then send them to one or more splunk instances after processing. This can be easily done as well. The following code sample was used to fetch the Log analytics events. For this exercise I am simply listing the results after fetching the events. I will skip the creation of Azure function and simply demonstrate the code in powershell ISE. There are code samples available for Python and .NET. The demonstration below uses the powershell code.
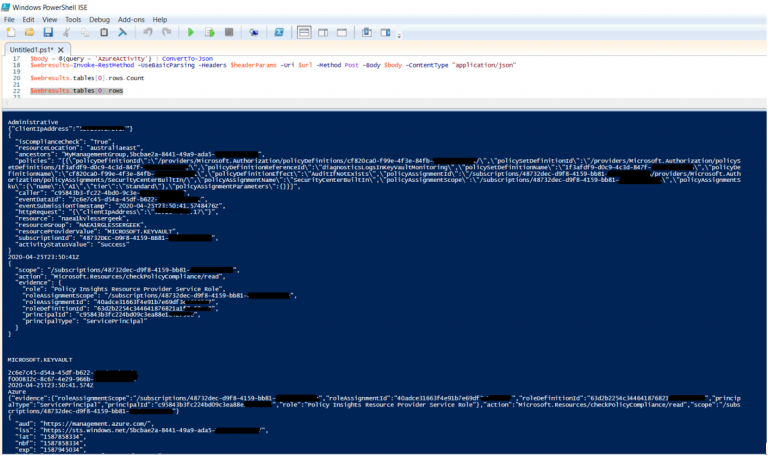
Running the script provided the same results we saw in the Splunk
#Here is the actual code for you to try on your Log analytics workspace
$SubscriptionId = ""
$TenantId       = ""
$ClientID       = ""
$ClientSecret   = ""
#$TenantDomain   = "$($env:TenantDomain)"
$loginURL       = "https://login.microsoftonline.com/$TenantId/oauth2/token"
$resource       = "https://api.loganalytics.io"

$body           = @{grant_type="client_credentials";resource=$resource;client_id=$ClientID;client_secret=$ClientSecret}
$oauth          = Invoke-RestMethod -Method Post -Uri $loginURL -Body $body
$headerParams = @{'Authorization'="$($oauth.token_type) $($oauth.access_token)"}

$Workspacename=""
$WorkspaceId=""

$url="https://api.loganalytics.io/v1/workspaces/$WorkspaceId/query"
$body = @{query = 'AzureActivity'} | ConvertTo-Json
$webresults=Invoke-RestMethod -UseBasicParsing -Headers $headerParams -Uri $url -Method Post -Body $body -ContentType "application/json"

$webresults.tables[0].rows.Count

$webresults.tables[0].rows

#alternate method
$queryResults = Invoke-AzOperationalInsightsQuery -WorkspaceId $WorkspaceId -Query "AzureActivity" -IncludeRender -IncludeStatistics
Conclusion
Log analytics plugin for Splunk makes it really easy to integrate log analytics with Splunk. The setup is fairly easy and took less than a couple of hours to setup. The entire setup can be deployed easily with code.
Log analytics is a preferred way for setting up logging and monitoring and some f the key benefits are
Pros
1. Azure policies available to enforce diagnostics integration with log analytics.
2. It is highly available, scalable and very reliable.
3. Long term retention is possible.
4. Very secure
Cons
1. There could be some delays with log ingestion
2. In the exercise above we had a pull model where log analytics addon is pulling events from Log analytics into splunk.
Note: If you desire a more real time option and a push model an alternate solution could be using Eventhubs but there are several considerations with using eventhubs as the eventhub solution would require separate eventhub namespace deployment needed for each region where you have your resources. If your resources are spread across multiple regions cost could be a factor. Also note that the integration of Eventhub with Azure monitor is only supported with an event hub with public endpoint. Having a firewall and network IP filtering rule will not allow events to successfully show up in event hub. Microsoft plans to support trusted service integration for Azure monitor in near future. Eventhubs with private endpoints work only in a eventhub cluster and are not supported for integration with Azure monitor.