Creating Power BI Reports with Log Analytics Workspace data
Power BI is a great tool from Microsoft which makes it easy to create reports and send them out on scheduled intervals. The ability to pick log analytics data and build reports from them is what we are going to explore today in this blog article.
Prerequisites
- You need a Power BI account. Microsoft provides a 60 days free trial account. A free account can help you build reports but the 60 days free trial will help you subscribe reports via emails.
- You will need to install Power BI desktop. The download is available here.
- You should have a log analytics workspace in Azure with a few days worth of activity captured. Setting up log analytics and capturing logs into a log analytics workspace will not be discussed in this blog.
Step 1: Verify you have some logs captured and ensure they are visible within a log analytics workspace. Run a Kusto query as shown below and you should be able to see the logs. you may want to limit the queries to last 24 hours otherwise the query might take too long to refresh and the dataset being fetched will keep increasing every day depending upon the data retention set on your log analytics workspace. To limit the query to last 24 hours the sample query would be
AzureActivity
| where TimeGenerated >= ago(24h)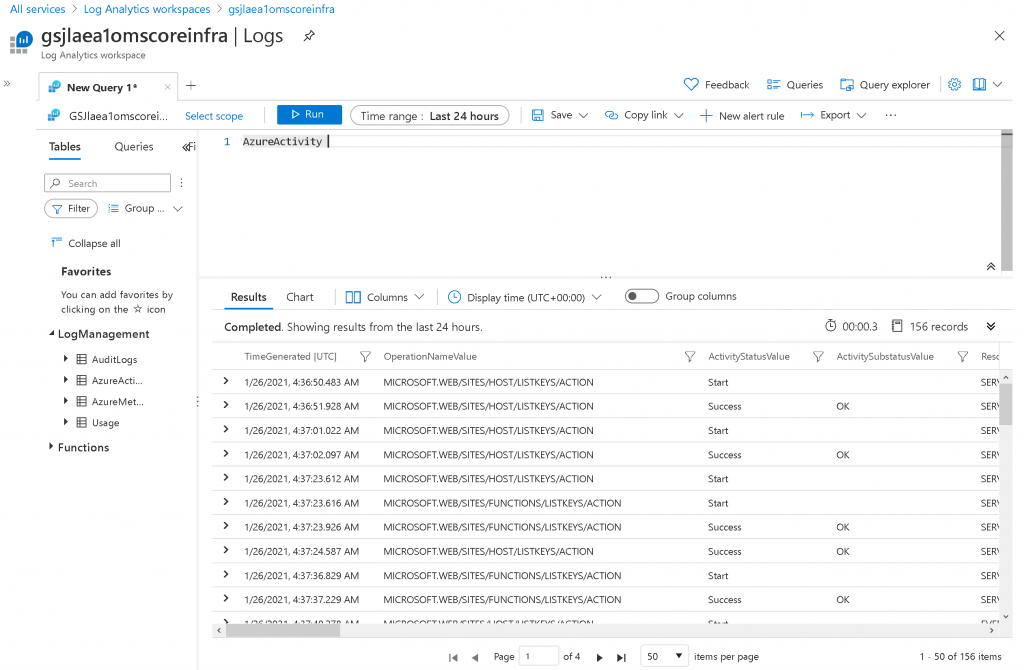
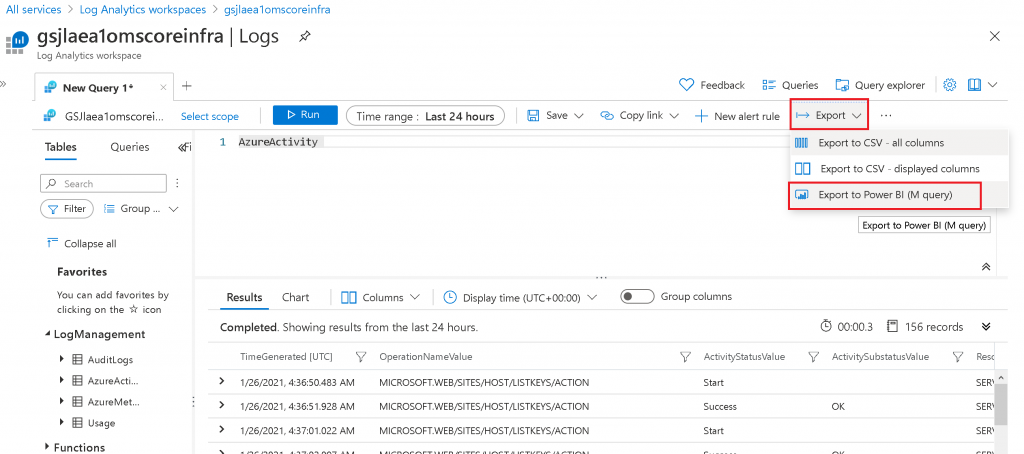
Step 2: Export the query into Power BI format. Click the links as shown below to get the text file with the Power BI (M query format)
Step 3: The text file can be opened in notepad to review the content which should look as shown below
/*
The exported Power Query Formula Language (M Language ) can be used with Power Query in Excel
and Power BI Desktop.
For Power BI Desktop follow the instructions below:
1) Download Power BI Desktop from https://powerbi.microsoft.com/desktop/
2) In Power BI Desktop select: 'Get Data' -> 'Blank Query'->'Advanced Query Editor'
3) Paste the M Language script into the Advanced Query Editor and select 'Done'
*/


let AnalyticsQuery =
let Source = Json.Document(Web.Contents("https://api.loganalytics.io/v1/workspaces/d906720b-b90d-4719-a7a1-ab19ae1372cc/query",
[Query=[#"query"="AzureActivity
| where TimeGenerated >= ago(24h)
",#"x-ms-app"="OmsAnalyticsPBI",#"prefer"="ai.response-thinning=true"],Timeout=#duration(0,0,4,0)])),
TypeMap = #table(
{ "AnalyticsTypes", "Type" },
{
{ "string",   Text.Type },
{ "int",      Int32.Type },
{ "long",     Int64.Type },
{ "real",     Double.Type },
{ "timespan", Duration.Type },
{ "datetime", DateTimeZone.Type },
{ "bool",     Logical.Type },
{ "guid",     Text.Type },
{ "dynamic",  Text.Type }
}),
DataTable = Source[tables]{0},
Columns = Table.FromRecords(DataTable[columns]),
ColumnsWithType = Table.Join(Columns, {"type"}, TypeMap , {"AnalyticsTypes"}),
Rows = Table.FromRows(DataTable[rows], Columns[name]),
Table = Table.TransformColumnTypes(Rows, Table.ToList(ColumnsWithType, (c) => { c{0}, c{3}}))
in
Table
in AnalyticsQuery
Step 4: Launch the Power BI desktop and open the query as shown below. Click the “Get Data” button and choose “Blank Query”. In the next step we will use the query exported in step 3.
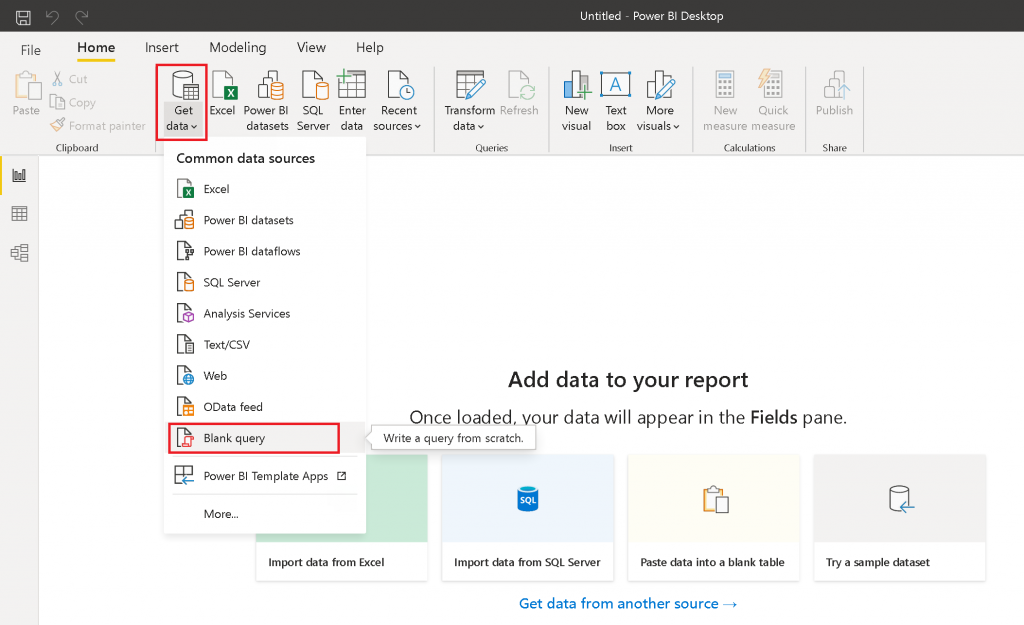
Step 5: In the query editor, click advanced editor
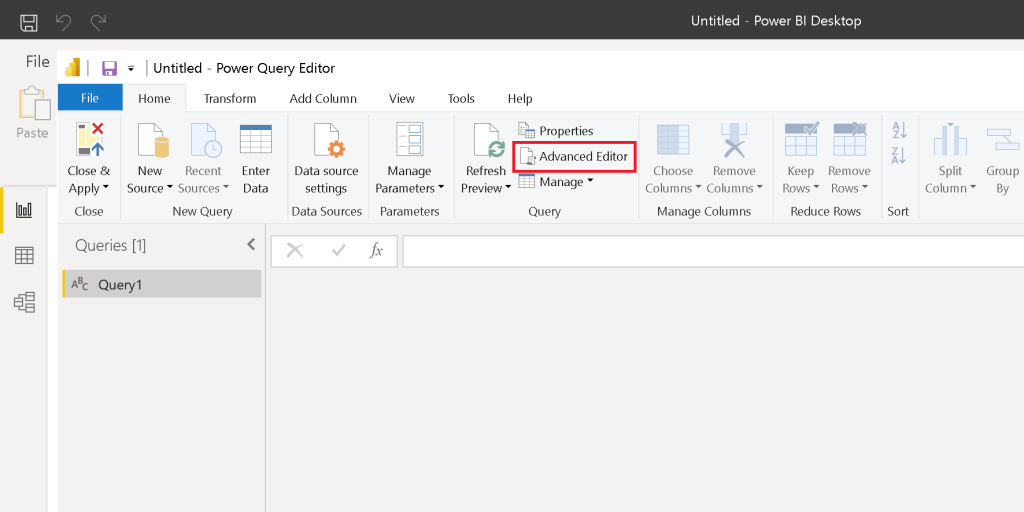
and paste the query we exported from log analytics workspace in step 3
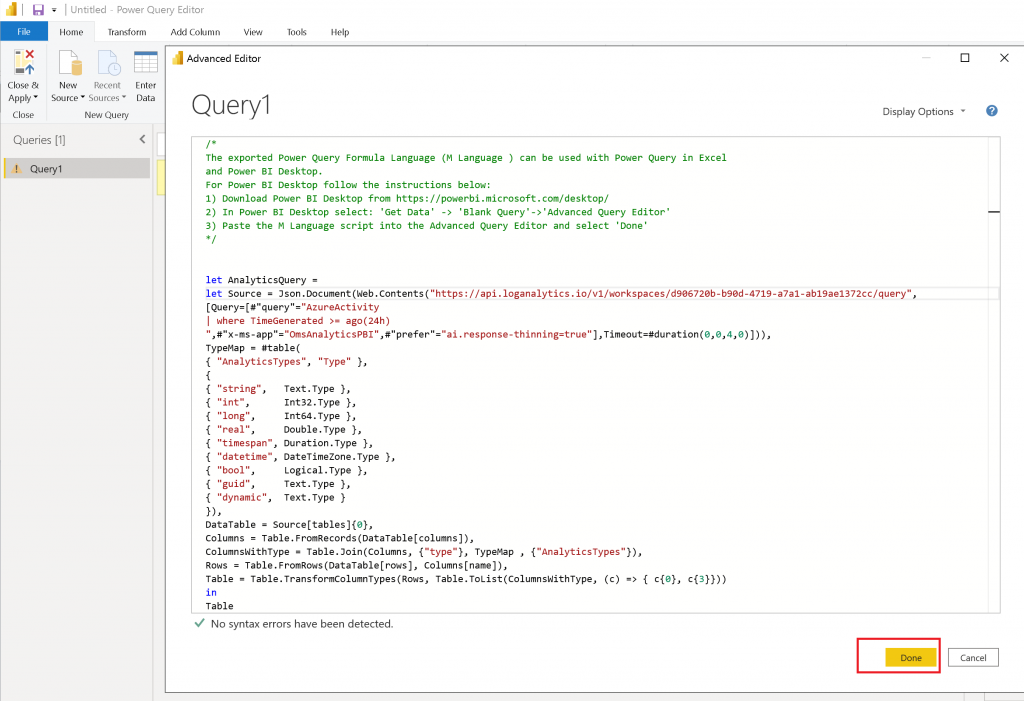
Click “Done”.
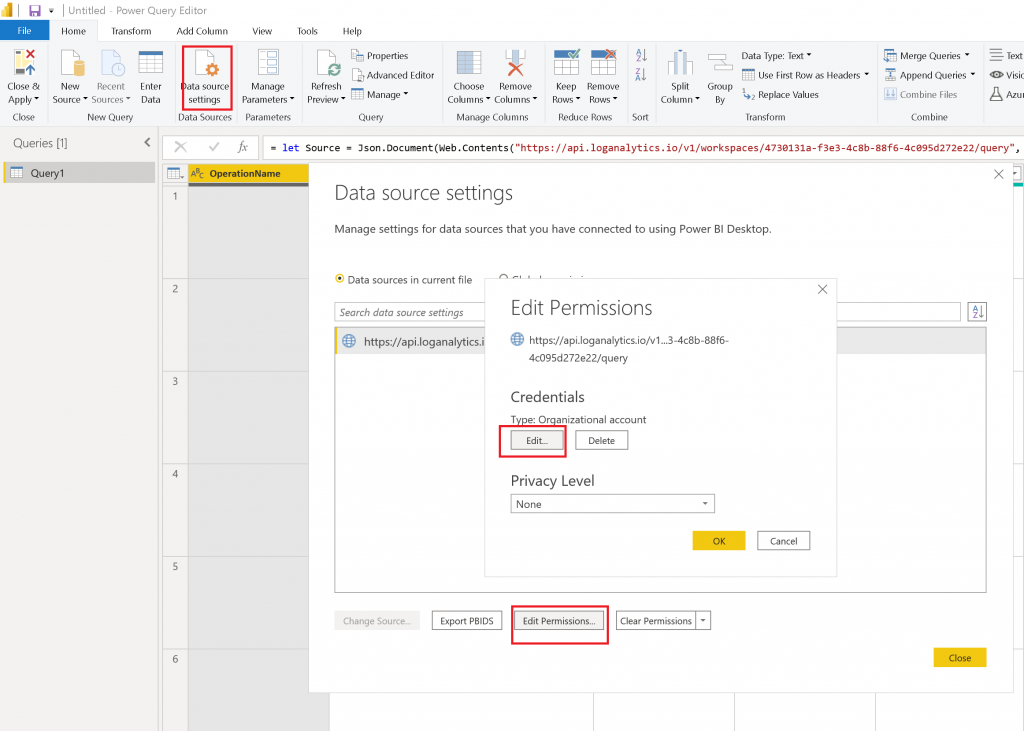
Step 6: At this stage you might have to login to the organization account with credentials that have permissions to read the data from the log analytics workspace. If you see any errors, click the “Data Source Settings” -> “Edit Permissions” and then “Edit Permissions”.
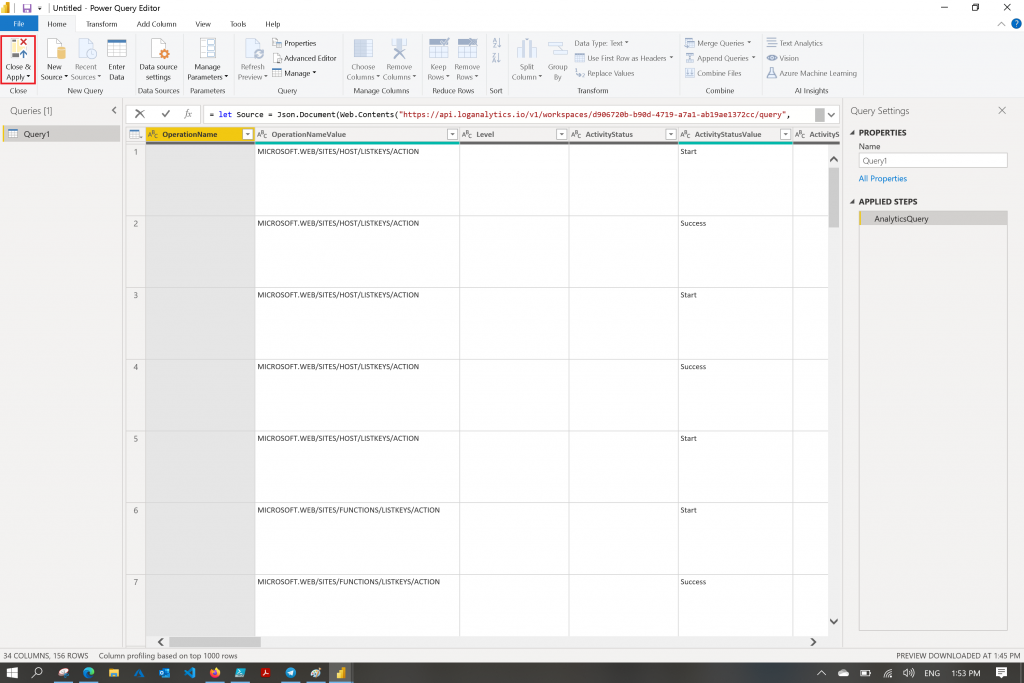
Step 7: If all goes well, you should be able to see the same dataset that was visible in Log analytics workspace. You can at this stage either change the column names by right clicking them and renaming them. You may want to remove columns you don’t need. Alternatively from within the Log analytics workspace you can use the project and extend to rename or select the columns you need to build your reports. Please note that any columns you rename or limit within the log analytics query will make the fetching reports slightly quicker as the data is received in Power BI preformatted. You should see the data as indicated in the below screenshot
Step 8: If you are happy with the data you see, you may want to proceed with the “Close and apply” to start working with the visual representation of the reports
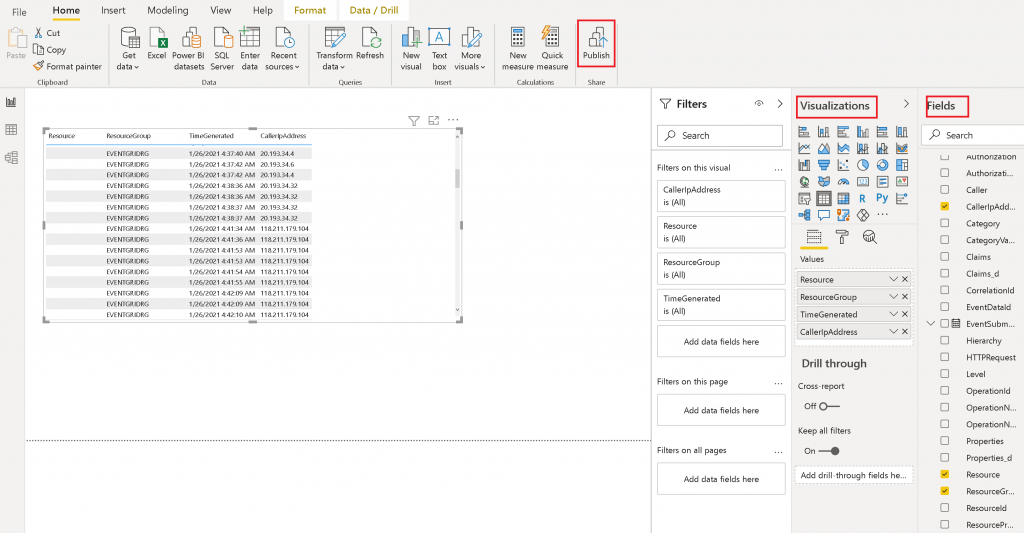
Step 9: You can drag drop fields, adjust the visualizations as you do in any Power BI report. Once you are ready to publish the report, Save the report and click “Publish”
Step 10: You can now login to the Power BI portal at https://powerbi.microsoft.com and work with the reports. You can share them with internal and external teams to and allow them to access the reports (free) or subscribe to send the reports via emails (requires subscription $9.99/user/month). For more details on pricing check here.
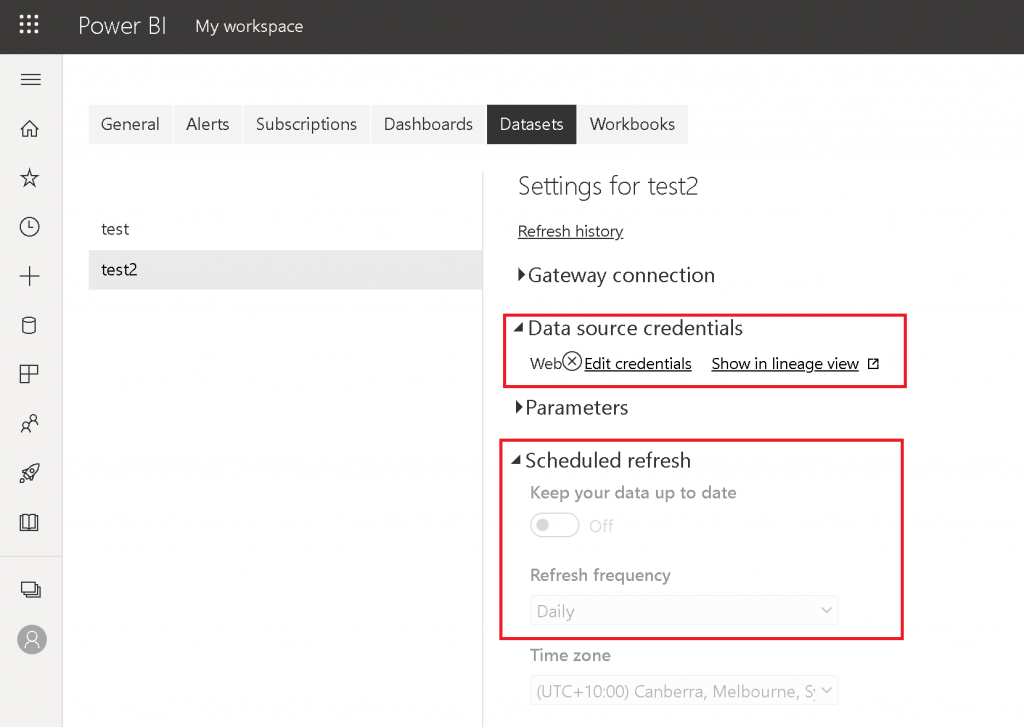
Step 11: Remember to setup a credentials for the report dataset under your workspaces and a scheduled refresh to fetch data from log analytics
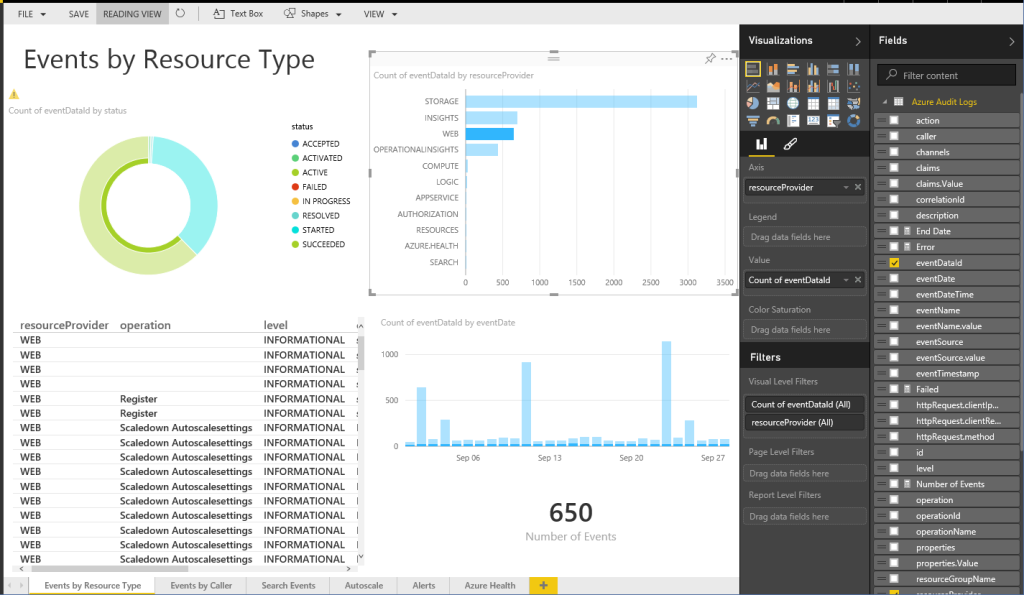
With every thing setup as desired you can have an amazing report available to you and your customers based on the data being pumped into log analytics
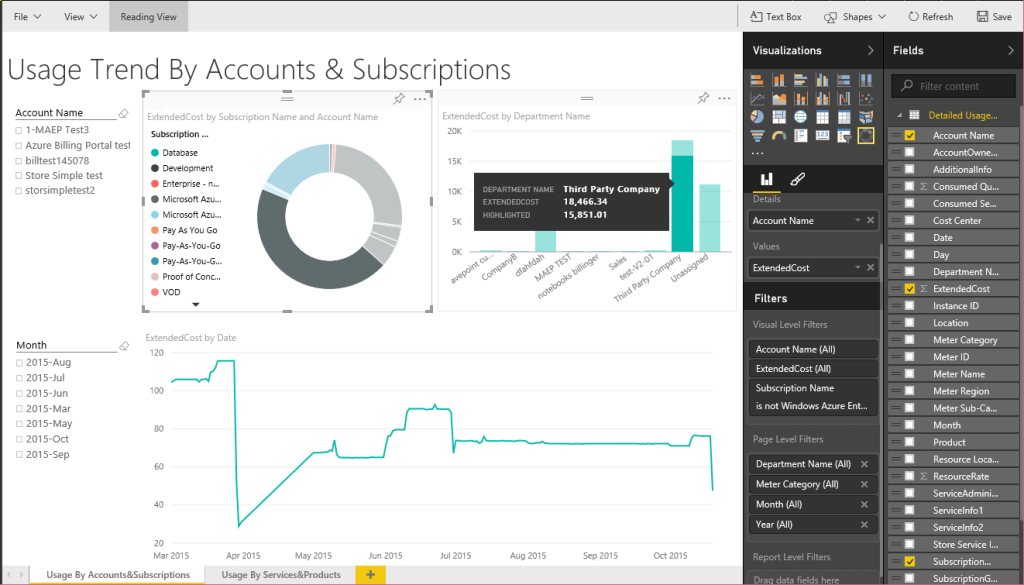
There are various content packs available which can make the Power BI reporting easy.
There are numerous ways to create templates, queries and also write automation for Azure, Log analytics as well as Power BI. Purpose of this article was to demonstrate the capabilities of Log analytics and Power Bi and the ease of integrating the two.
If you have any feedback, comments, queries related with this blog post feel free to write to me at gsjutla@lessergeek.com